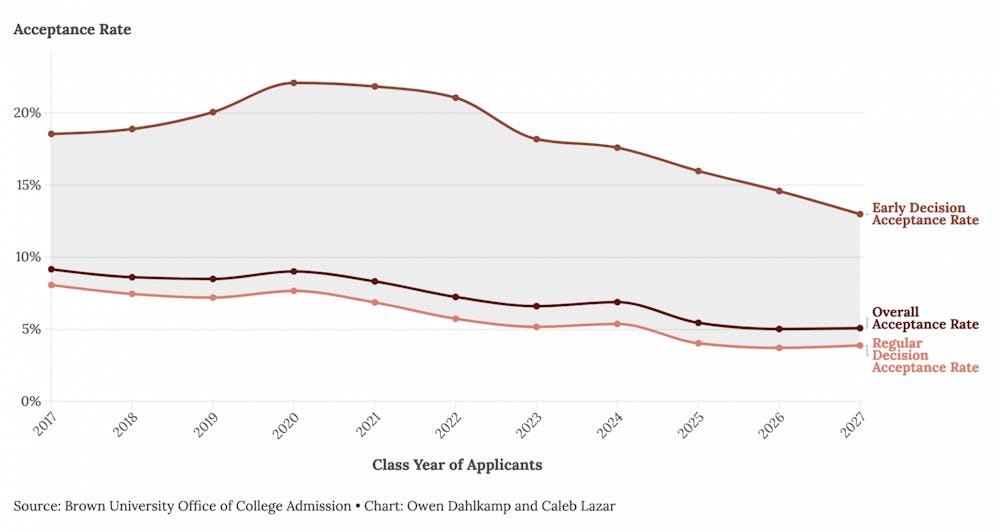
The University extended offers of admission to 1,730 regular decision applicants Thursday evening, bringing the total acceptance rate for the class of 2027 to 5.08%, Associate Provost for Enrollment and Dean of Admission Logan Powell wrote in an email to The Herald.
With 51,302 applications in total, the University saw its largest undergraduate applicant pool ever, over 650 more than last year’s 50,649. And with an overall acceptance rate of 5.08% and a 3.8% acceptance rate for regular decision applicants, this year marked the second-most selective application cycle in the University’s history.
Only the class of 2026 had a more competitive process, with an acceptance rate of 5.03% and a regular decision acceptance rate of 3.6%.
“The admitted class of 2027 is remarkable in their level of achievement and the breadth of their backgrounds,” Powell wrote, describing the cohort as “creative, talented, community-oriented and incredibly energized about improving their communities and the world.”
The Herald received a breakdown of this year’s admitted students by gender, geography, high school background and more. You can explore the admissions data for the class of 2027 and compare it with data from past years using our interactive site.
Dual-degree programs
Dual-degree programs saw record-low acceptance rates, which have declined since the 2020-21 cycle. Less than two percent of applicants — 74 out of 4,192 — were admitted to the Program in Liberal Medical Education. The Brown-RISD dual degree program accepted a cohort of 20 after reviewing 916 applications, an acceptance rate of just over 2%.
Gender
The number of men and women admitted to the class of 2027 was nearly identical, with 1,305 accepted applicants identifying as female and 1,304 as male. Powell declined to provide the number of applicants by gender, but noted that a recently published article in The Herald gives “a sense of the landscape at Brown.”
For the class of 2026, nearly two-thirds of applicants were women, while 50.2% of admitted students were women.
“This is a topic we continue to carefully consider in the context of national trends,” Powell added.
Intended concentrations
The top indicated concentrations for the class of 2027 were computer science, economics, political science, engineering and International and Public Affairs. Neuroscience has fallen off this list for the first time in over a decade.
Geographic backgrounds
11% of the admitted class — approximately 287 students — consists of international students, defined by their citizenship status. Powell was unable to provide past data, citing “massive disruptions due to COVID travel restrictions” and “increases to financial aid for international students last year and this year.”
Outside of the United States, countries with the most representation at the University include China, Canada, the United Kingdom, India, South Korea, Pakistan and Singapore.
Domestically, admitted students hail from all 50 states, as well as Washington D.C., Guam, Puerto Rico and the Virgin Islands. The most represented states were California, New York, Massachusetts, New Jersey and Texas, roughly consistent with previous years. Powell also noted growth in applications from students in Providence.
Eight percent of this year’s admitted class reside in rural areas, a 3% increase from last year’s admitted pool.
High schools
In past years, more than half of admitted students attended public schools. The University maintained this trend with 60% of prospective students in the class of 2027 attending public high schools. The remaining 30% attended private high schools and 10% completed their secondary education at parochial schools. This does not include students who were homeschooled or did not provide their school type in their application.
18% of admitted students identified as first-generation college students, a 1% increase from the class of 2026.
Financial aid
Sixty-eight percent of admitted students indicated that they intended to apply for financial aid. Powell did not provide the size or number of financial aid packages provided due to the changing nature of financial aid awards.
Looking ahead
Data relating to the diversity of applicants and accepted students has not been provided by the Office of College Admission since 2021, though the enrolled class’s demographics will continue to be published in the University’s Common Data Set, according to Powell.
In recent years, Princeton, Cornell, Penn, Columbia and Stanford have declined to release admissions data on the day decisions are released.
Brown does not currently plan to follow suit, according to Powell: “The Brown community and prospective applicants benefit from learning more about the admission process and its outcomes,” he said, noting he hoped it would “demystify some elements of this pivotal experience.”
According to Powell, the University also expects approximately 1,000 students to accept a place on the waitlist. In recent years, the University has accepted between two and 300 students from the waitlist, The Herald previously reported.
The University plans to host A Day on College Hill, its on-campus event for admitted students to visit Brown as part of their enrollment decision, on April 14 and 21. Virtual programming will continue through the Office’s online platform, the “Bruniverse.”
Accepted students must inform the University of their enrollment decision by May 1. With nearly 67% of admitted students accepting their place at Brown last year, the University aims to enroll 1,700 students to join Brown University’s class of 2027.

Owen Dahlkamp is a section editor overseeing coverage for University News and Science and Research. Hailing from San Diego, CA, he is concentrating in Political Science and Cognitive Neuroscience with an interest in data analytics. In his free time, you can find him making spreadsheets at Dave’s Coffee.


