Fall 2017 poll results can be found here.
Do you approve or disapprove of the way Christina Paxson is handling her job as president of the University?
16.2% Strongly approve
45.7% Somewhat approve
9.1% Somewhat disapprove
1.6% Strongly disapprove
27.4% No opinion
Do you approve or disapprove of the way the Undergraduate council of Students is handling its job representing and addressing the concerns of the undergraduate student body?
11.8% Strongly approve
41.1% Somewhat approve
7.9% Somewhat disapprove
2.2% Strongly disapprove
37% No opinion
Do you agree with the College Curriculum Council’s proposal to move the course drop deadline closer to the middle of the semester?
23.4% Strongly approve
16.3% Somewhat approve
15.8% Somewhat disapprove
35.3% Strongly disapprove
9.3% No opinion
If you have visited Health Services, how satisfied were you with the care that you received?
38.3% Very satisfied
30.8% Somewhat satisfied
9.9% Somewhat unsatisfied
2.7% Very unsatisfied
18.3% No opinion
How many of your friends come from a socioeconomic background similar to yours?
17.4% Most (more than 75% roughly) of my friends
25.5% The majority (more than 50%) of my friends
34.5% About equal (50%) of my friends
15.8% A minority (less than 50%) of my friends
6.8% Very few (less than 25%) of my friends
How often you catcalled on or near campus?
1.5% Everyday
10.7% At least once a week
18.3% At least once a month
27.8% Rarely
41.7% Never
If you do not intend to study abroad, what factors influenced your decision? (Circle all that apply)
27.3% Personal preference
35.9% Concentration requirements
23.7% Financial concerns
11.3% Recruitment for internships
10.5% Social concerns
17.3% Extracurricular commitments
8.5% No program interested me
1% I did not qualify for the program of my choice
9.4% Other
How confident or concerned are you in your ability to get a job in your chosen field with your Brown degree?
31.2% Very confident
42.6% Somewhat confident
18.3% Somewhat concerned
4.4% Very concerned
3.6% No opinion
Do you believe your professors facilitate discussions that respect opposing points of view?
19.1% Strongly agree
47.9% Somewhat agree
19.4% Somewhat disagree
4.5% Strongly disagree
9.1% No opinion
After President Trump’s election, how were the following aspects of your life changed?
Consumption of news
Increase: 59.4%
Decrease: 17.4%
Neutral: 23.2%
Visits home
Increase: 6.3%
Decrease: 5.7%
Neutral: 88.0%
Social media engagement
Increase: 29.4%
Decrease: 17.8%
Neutral: 52.7%
Participation in activism
Increase: 47.8%
Decrease: 3.1%
Neutral: 49.1%
After President Trump’s election, how did the following aspects of your life positively or negatively change?
Relationship with friends
Positive: 23.8%
Negative: 8.0%
Neutral: 68.2%
Relationship with family
Positive: 20.2%
Negative: 9.8%
Neutral: 70.4%
In the past year, which of the following substance have you used recreationally?
80.8% Alcohol
49.9% Marijuana
18.1% Tobacco
3.6% Prescription painkillers
4.7% Amphetamines
7% Cocaine
5.5% Ecstasy
6.1% Psychedelic mushrooms
6.2% LSD
1.1% Other
0.0% I don’t know
7.5% None of the above
Do you believe that Brown has school spirit?
10.8% Strongly agree
44.9% Somewhat agree
24.5% Somewhat disagree
13.8% Strongly disagree
6.0% No opinion
over the course of four days — Nov. 8-10 and Nov. 15. The margin of error is 3.1 percent with 95 percent confidence. The margins of error for specific subsets are as follows: 4.2 percent for females, 5.0 percent for males, 6.2 percent for first-years, 5.8 percent for sophomores, 7.1 percent for juniors, 7.5 percent for seniors, 4.6 percent for students who receive financial aid and 4.6 percent for students who do not receive financial aid.
The sample of students who took the poll is demographically similar to the undergraduate student body. The sample was 41.5 percent male and 57.4 percent female. First-years made up 27.8 percent, sophomores 31.6 percent, juniors 21.3 percent and seniors 19.3 percent of the poll. Of students represented in the poll, 6.3 percent receive just loans, 18.9 receive grants and loans, 15.2 percent receive grants covering some costs, 9.6 percent receive grants covering all costs and 50.1 percent receive no financial aid. Varsity athletes made up 9.8 percent, while non-athletes made up 90.2 percent. Of students surveyed, 78.4 percent identify as heterosexual, 6.1 percent as gay, 10.5 percent as bisexual and 5.0 percent as other.
Of students surveyed, 55.4 percent identify as white, 32.2 percent as Asian, 12.3 percent as Hispanic, 9.5 percent as black, 1.2 percent as American Indian/Alaska Native, 0.6 percent as
Native Hawaiian/Pacific Islander and 3.3 percent as other. Students also marked the concentration area(s) that they are in — 31.8 percent are in the humanities/arts, 21.4 percent in life sciences, 34.8 percent in physical sciences, 11.5 percent in BEO or economics and 22.5 percent in social sciences. Of students polled, 13.7 percent of students are legacy students, meaning they have a parent, grandparent or sibling who attended Brown, and 86.3 percent are not. First-generation students made up 18.1 percent of students surveyed and non-first-gen students made up 81.9 percent of the sample.
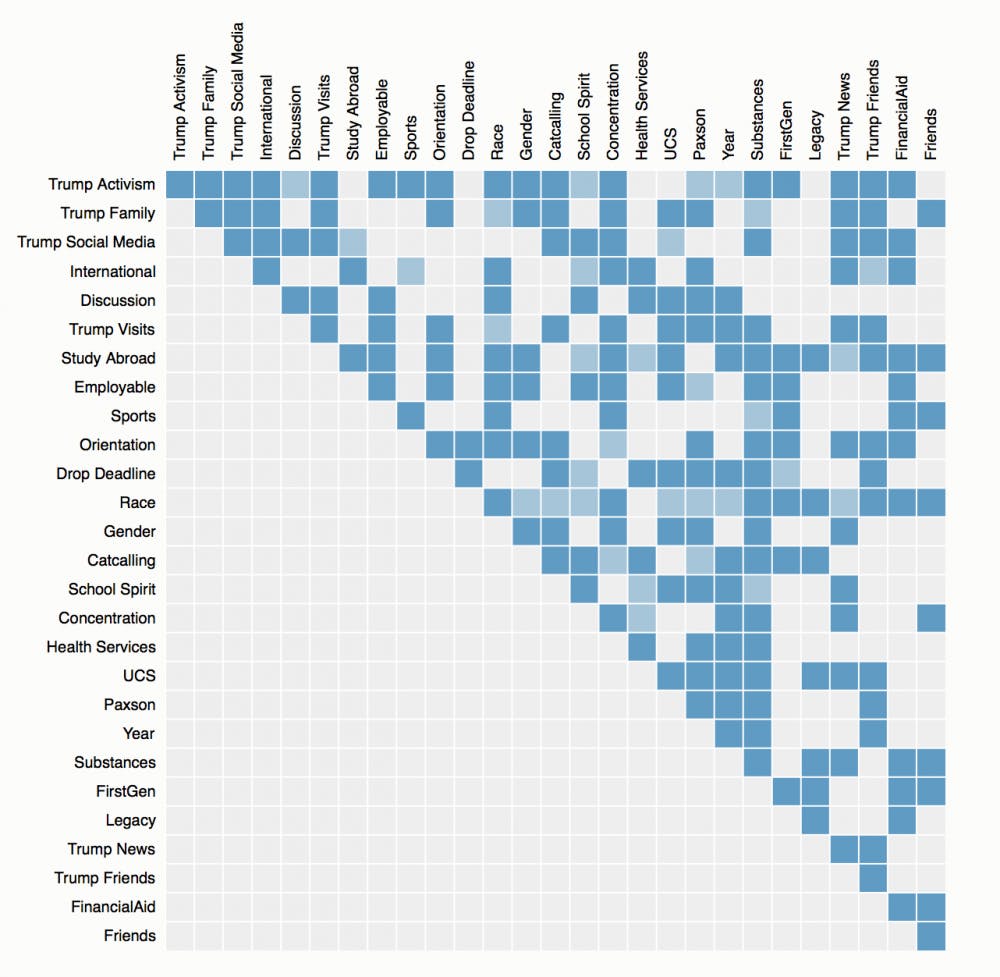
Statistical significance was established at the 0.05 level. All cross tabulations are statistically significant.
Science & Research Editor Elena Renken ’19, Metro Editor Gwen Everett ’19, Senior Staff Writer Emily Davies ’19.5 and Staff Writers Arjun Ganga ’21 and Sophie Culpepper ’21 coordinated the poll. Herald section editors, senior staff writers and other staff members conducted the poll.
Over the next several weeks, The Herald will publish a series of articles about individual poll questions. Find results of previous polls at thebdh.org/poll.


