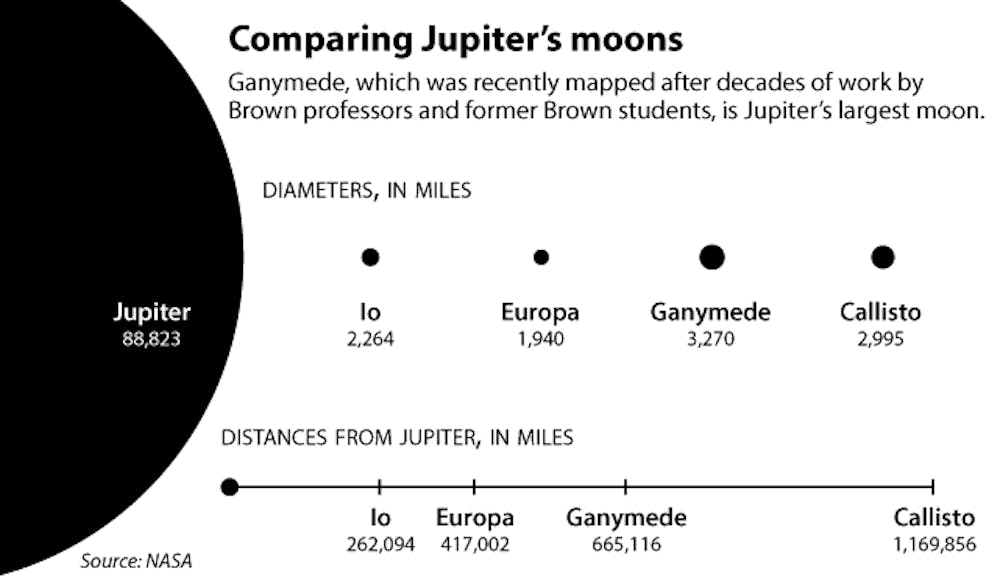
The first global map of the largest moon in the solar system — Ganymede, one of Jupiter’s moons — shows a sharp contrast between older cratered areas and newer, lighter terrain. The map was published last Wednesday after decades of research conducted by a team that included Brown professors and former Brown students.
“The map is … important in terms of helping us to target our future exploration in the system,” said the map’s lead creator, Geoffrey Collins PhD’00, now a professor of geology at Wheaton College in Norton, Mass.
The map is “vital to the planning and success” of an upcoming mission to Jupiter, wrote Michael Bland, a research scientist at Washington University in St. Louis, in an email to The Herald.
The European Space Agency is planning to launch a mission in 2022 that will arrive at Jupiter in 2030 to study the planet and three of its moons — Ganymede, Callisto, and Europa.
“Between now and 2030, this will be the best map you’re going to get,” Collins said.
Unveiling the surface
The map will also help scientists understand the solar system by looking at the miniature solar system that Jupiter and its moons make up, said Jim Head, a professor of geological sciences who helped create the map.
Ganymede, Jupiter’s third-closest moon, primarily contains heavily cratered, dark terrain, Head said. The dark terrain indicates older portions of the icy surface of the moon with more rock content, according to the National Aeronautics and Space Administration website.
The dark terrain is broken up into polygons with bright material constituting newer formations of ice between them, Head said.
“At some point most of Ganymede’s surface was replaced with clean white ice that tore apart that dark terrain,” Collins said. “The exciting thing is we can piece all these things together and really see the amount of the planet that’s been modified and how it’s been modified,” he added. The patterns of creases in the dark terrain show stresses where external bodies hit the planet or where internal heat and shifting of the crust occurred.
Since Ganymede contains water, an internal heat source and possibly organic material from meteorites, there might be life in between the cold, icy surface of the moon and its warmer interior, Head said.
Bland, who was not involved in the map’s creation, called its construction “a significant advancement in understanding the geologic evolution of the solar system’s largest moon.”
“With the map, we can clearly see both the diversity and spatial distribution of landforms on Ganymede’s surface,” he added, “which provide important clues to unraveling its long history.”
The map allows scientists to compare the various moons orbiting Jupiter, Head said. He noted that the map shows the evolution of Ganymede’s surface, which started out similar to the surface of Callisto, Jupiter’s outermost moon, until, “Wham! Something heavily altered (its) whole surface.”
Collins said the map gives scientists the first “global view and timeline” of the moon.
Decades of research
The research leading up to the creation of this map began at the University several decades ago, with the researchers now spread all across the country, Head said.
The researchers developed the map using data from the Voyager and Galileo spacecraft, Collins said.
“Those are the only two missions that have seen Ganymede up close,” Collins said, adding that other spacecraft have flown close to the moon but have not captured images as clear as those from Voyager and Galileo.
Head was one of the co-investigators on the Galileo mission, which was the first to use an advanced type of imaging called solid-state imaging.
During the Galileo mission the transmitting antenna malfunctioned, limiting the amount of information that could be sent back to Earth, Collins said. Still, Head said, the spacecraft was able to take and transmit a number of pictures, albeit slowly.
The mission terminated in 2003 when the satellite flew into Jupiter.
All images used to create the map had been collected by 2003, but this is the first time they have been compiled into a comprehensive map, Collins said.
At first the scientists began mapping without sophisticated software, and Collins developed tennis elbow from drawing the lines of the plates on the moon, he said, adding that more sophisticated software was used later in the study.
“It was really exciting to see the surface unfold from information we put in,” Head said.
Collins said the Galileo mission and creation of this map was a key reason he came to Brown, as he had heard Head was a co-investigator for the mission.
“I actually have a soft spot for Ganymede,” Collins said. “As a kid I had a picture of Ganymede in my room.”

ADVERTISEMENT


